The countries or regions where the WTO issued the import and export trade of automotive products (including spare parts, the same below) are the EU-27 countries, the United States, Canada, Mexico, Japan, China, Brazil, Malaysia, Singapore and Hong Kong. Among them, where is China's total import and export trade in automotive products in these 10 economies? What is the difference between exports and imports?
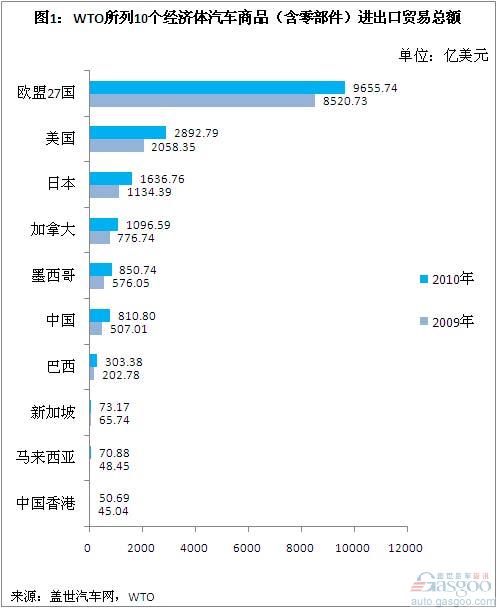
Total trade in automotive goods: China is lower than Mexico, Canada, and other trade data compiled by Gasgoo.com in 2009 and 2010. The highest total import and export trade of automobile products is in the EU-27, followed by the United States, Japan, and Canada. And Mexico. Mexico’s total merchandise trade in 2009 and 2010 was US$ 57.605 billion and US$ 85.074 billion, respectively. Followed by China - 2009 and 2010, the total amount of auto trade was 50.701 billion U.S. dollars and 81.80 billion U.S. dollars, respectively.
The total amount of auto trade in Brazil in 2009 and 2010 was only 40.0% and 37.4% of that of China, namely 20.277 billion U.S. dollars and 30.338 billion U.S. dollars. In the past two years, the total volume of auto trade of Singapore, Malaysia and Hong Kong was less than US$7.5 billion.
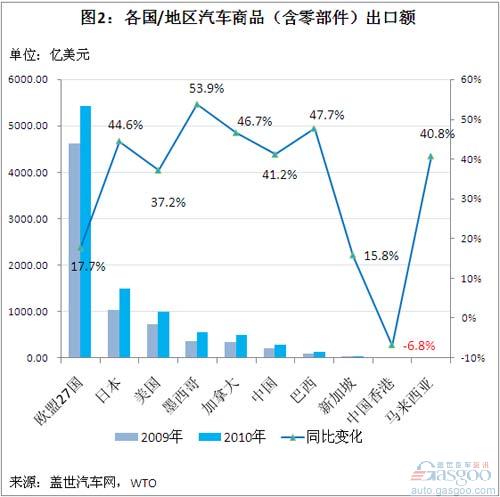
Exports of automotive goods: Mexico, Brazil, Canada, and Japan saw a rapid increase in exports of automotive goods in 2009 and 2010. The highest and lowest economies in the above mentioned countries were the European Union's 27 countries, Japan, the United States, Mexico, Canada, China, and Brazil. , Singapore, Hong Kong, and Malaysia.
Among them, the fastest growing export value in 2010 was in Mexico - an increase of 53.9% to US$ 55.635 billion; followed by Brazil, Canada, and Japan, which increased by 47.7%, 46.7%, and 44.6%, respectively, to US$ 12.639 billion, US$ 50.118 billion, and 1495.16 One hundred million U.S. dollars. While China only grew 41.2% to US$28.037 billion, Hong Kong China fell 6.8% to US$1.552 billion.
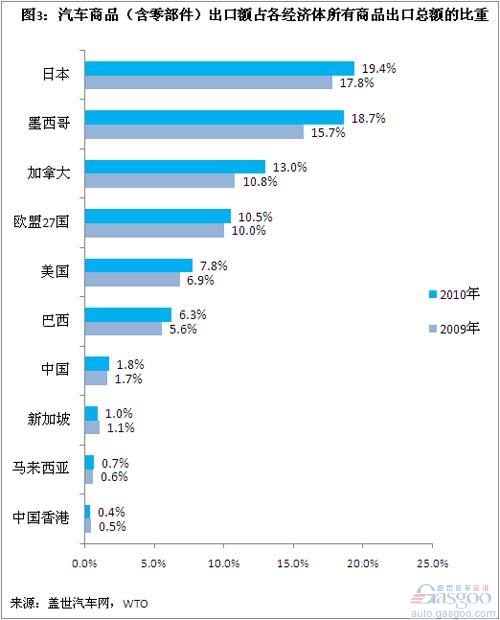
Automobiles account for the proportion of total exports of all commodities: Japan and Mexico have the highest percentage of automotive goods in total exports of all the above-mentioned economies. The highest is Japan, followed by Mexico. The export of automotive products in these two countries accounted for more than 15% of the total exports of all their commodities. In 2009, Japan and Mexico accounted for 17.8% and 15.7% of automotive exports, respectively, and in 2010 they increased to 19.4% and 18.7% respectively.
Other economies with high export volume of automotive products are Canada and 27 EU countries, both exceeding 10%. In 2009, they were 10.8% and 10.0% respectively. In 2010, they increased to 13.0% and 10.5% respectively.
The United States and Brazil’s auto exports accounted for more than 6% of their total merchandise exports in 2010, with 7.8% and 6.3%, respectively. However, China’s auto exports in 2010 accounted for only 1.8% of total merchandise exports, a slight increase of 0.1 percentage points from 2009.
On the whole, except for Singapore and Hong Kong, the other 10 economies mentioned above have seen an increase in the proportion of other auto exports in 2010. The fastest increase was in Mexico and Canada.
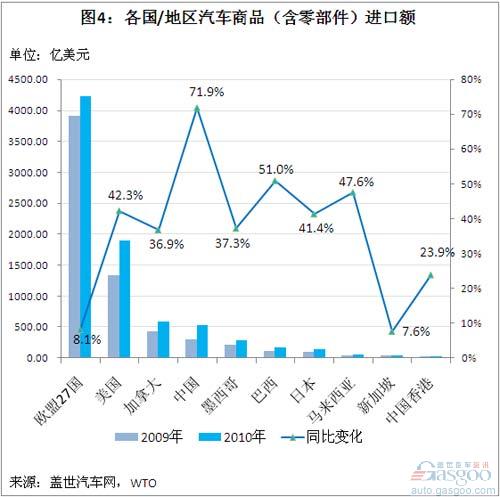
Imports of auto goods: China has the fastest growth rate, EU-27 countries and Singapore have the slowest growth in the number of auto goods imports in 2009 and 2010. From the highest to the lowest, the above-mentioned economies are the EU-27 countries, the United States, Canada, China, and Mexico. Brazil, Japan, Malaysia, Singapore, Hong Kong, China. China's total auto trade volume and exports are lower than Mexico's, but imports (2009 and 2010 were 30.848 billion U.S. dollars and 53.043 billion U.S. dollars, respectively) higher than Mexico (2009 and 2010 were 21.454 billion U.S. dollars and 29. 39 billion U.S. dollars, respectively) .
Among the 10 economies, China’s fastest-growing growth in auto imports in 2010 was a year-on-year increase of 71.9%; followed by Brazil and Malaysia, an increase of around 50%; Brazil’s auto imports increased by 51.0% to US$ 17.698 billion. It increased by 47.6% to US$5.76 billion. Brazil has increased its auto import tariffs this year, and its import growth of auto products may gradually slow down.
In the United States and Japan, the import volume of auto goods in 2010 increased by 42.3% and 41.4%, respectively. However, the United States has a high base. In 2010, the import value of auto goods reached US$189.765 billion. In Japan, the base figure is relatively low. In 2010, the auto products imported only reached US$ 14.16 billion, which is only one third of that in China and 7.5% in the United States. .
Among the 10 economies, the slowest growth in the value of imports of automotive goods in 2010 was the EU-27 and Singapore, which grew by only 8.1% and 7.6% respectively.
Trade balance of auto goods: Japan and EU have the biggest surpluses, Mexico has the fastest growth rate, and China has the fastest growth in deficit. Of the 10 economies mentioned above, in 2009 and 2010, the trade surplus of auto goods was Japan, EU-27, and Mexico. Among them, Japan’s auto goods trade has the largest surplus, with a surplus of USD 93.411 billion in 2009 and a growth of 44.9% in 2010 to USD 135.357 billion. The surplus of the European Union’s 27 countries in 2010 also exceeded 100 billion U.S. dollars, reaching US$119.928 billion, an increase of 71.0% over 2009.
Mexico’s trade surplus in 2009 was US$14.709 billion in 2010, an increase of 78.1% in 2010 to US$26.196 billion, which is the fastest-growing surplus among the three surplus economies.
In the other seven economies, the trade in automotive goods was a deficit, with the highest deficit being in the United States, followed by China. The US automobile trade deficit in 2010 was US$90.25 billion, which was 48.4% higher than in 2009. China’s 2010 was US$25.006 billion, which was a year-on-year increase of 127.4%. This is the fastest growing deficit in the economy of the automobile trade deficit in this article. .
In Brazil, Malaysia and Hong Kong, the deficit in the auto trade of goods in 2010 also increased by more than 49%. Among them, the deficit in Brazil increased by 59.7% to US$5.059 billion.
While the Canadian and Singapore’s auto goods trade deficits, the deficit in 2010 in Canada only increased by 1.0% to US$9.423 billion, while that in Singapore decreased by 27.3% to US$502 million.
Note:
The WTO has not released data on countries such as India. This does not mean that the import and export volume of auto products in these countries is relatively low. Russia has not yet formally joined the WTO and is therefore not listed.
Total trade in automotive goods: China is lower than Mexico, Canada, and other trade data compiled by Gasgoo.com in 2009 and 2010. The highest total import and export trade of automobile products is in the EU-27, followed by the United States, Japan, and Canada. And Mexico. Mexico’s total merchandise trade in 2009 and 2010 was US$ 57.605 billion and US$ 85.074 billion, respectively. Followed by China - 2009 and 2010, the total amount of auto trade was 50.701 billion U.S. dollars and 81.80 billion U.S. dollars, respectively.
The total amount of auto trade in Brazil in 2009 and 2010 was only 40.0% and 37.4% of that of China, namely 20.277 billion U.S. dollars and 30.338 billion U.S. dollars. In the past two years, the total volume of auto trade of Singapore, Malaysia and Hong Kong was less than US$7.5 billion.
Exports of automotive goods: Mexico, Brazil, Canada, and Japan saw a rapid increase in exports of automotive goods in 2009 and 2010. The highest and lowest economies in the above mentioned countries were the European Union's 27 countries, Japan, the United States, Mexico, Canada, China, and Brazil. , Singapore, Hong Kong, and Malaysia.
Among them, the fastest growing export value in 2010 was in Mexico - an increase of 53.9% to US$ 55.635 billion; followed by Brazil, Canada, and Japan, which increased by 47.7%, 46.7%, and 44.6%, respectively, to US$ 12.639 billion, US$ 50.118 billion, and 1495.16 One hundred million U.S. dollars. While China only grew 41.2% to US$28.037 billion, Hong Kong China fell 6.8% to US$1.552 billion.
Automobiles account for the proportion of total exports of all commodities: Japan and Mexico have the highest percentage of automotive goods in total exports of all the above-mentioned economies. The highest is Japan, followed by Mexico. The export of automotive products in these two countries accounted for more than 15% of the total exports of all their commodities. In 2009, Japan and Mexico accounted for 17.8% and 15.7% of automotive exports, respectively, and in 2010 they increased to 19.4% and 18.7% respectively.
Other economies with high export volume of automotive products are Canada and 27 EU countries, both exceeding 10%. In 2009, they were 10.8% and 10.0% respectively. In 2010, they increased to 13.0% and 10.5% respectively.
The United States and Brazil’s auto exports accounted for more than 6% of their total merchandise exports in 2010, with 7.8% and 6.3%, respectively. However, China’s auto exports in 2010 accounted for only 1.8% of total merchandise exports, a slight increase of 0.1 percentage points from 2009.
On the whole, except for Singapore and Hong Kong, the other 10 economies mentioned above have seen an increase in the proportion of other auto exports in 2010. The fastest increase was in Mexico and Canada.
Imports of auto goods: China has the fastest growth rate, EU-27 countries and Singapore have the slowest growth in the number of auto goods imports in 2009 and 2010. From the highest to the lowest, the above-mentioned economies are the EU-27 countries, the United States, Canada, China, and Mexico. Brazil, Japan, Malaysia, Singapore, Hong Kong, China. China's total auto trade volume and exports are lower than Mexico's, but imports (2009 and 2010 were 30.848 billion U.S. dollars and 53.043 billion U.S. dollars, respectively) higher than Mexico (2009 and 2010 were 21.454 billion U.S. dollars and 29. 39 billion U.S. dollars, respectively) .
Among the 10 economies, China’s fastest-growing growth in auto imports in 2010 was a year-on-year increase of 71.9%; followed by Brazil and Malaysia, an increase of around 50%; Brazil’s auto imports increased by 51.0% to US$ 17.698 billion. It increased by 47.6% to US$5.76 billion. Brazil has increased its auto import tariffs this year, and its import growth of auto products may gradually slow down.
In the United States and Japan, the import volume of auto goods in 2010 increased by 42.3% and 41.4%, respectively. However, the United States has a high base. In 2010, the import value of auto goods reached US$189.765 billion. In Japan, the base figure is relatively low. In 2010, the auto products imported only reached US$ 14.16 billion, which is only one third of that in China and 7.5% in the United States. .
Among the 10 economies, the slowest growth in the value of imports of automotive goods in 2010 was the EU-27 and Singapore, which grew by only 8.1% and 7.6% respectively.
Trade balance of auto goods: Japan and EU have the biggest surpluses, Mexico has the fastest growth rate, and China has the fastest growth in deficit. Of the 10 economies mentioned above, in 2009 and 2010, the trade surplus of auto goods was Japan, EU-27, and Mexico. Among them, Japan’s auto goods trade has the largest surplus, with a surplus of USD 93.411 billion in 2009 and a growth of 44.9% in 2010 to USD 135.357 billion. The surplus of the European Union’s 27 countries in 2010 also exceeded 100 billion U.S. dollars, reaching US$119.928 billion, an increase of 71.0% over 2009.
Mexico’s trade surplus in 2009 was US$14.709 billion in 2010, an increase of 78.1% in 2010 to US$26.196 billion, which is the fastest-growing surplus among the three surplus economies.
In the other seven economies, the trade in automotive goods was a deficit, with the highest deficit being in the United States, followed by China. The US automobile trade deficit in 2010 was US$90.25 billion, which was 48.4% higher than in 2009. China’s 2010 was US$25.006 billion, which was a year-on-year increase of 127.4%. This is the fastest growing deficit in the economy of the automobile trade deficit in this article. .
In Brazil, Malaysia and Hong Kong, the deficit in the auto trade of goods in 2010 also increased by more than 49%. Among them, the deficit in Brazil increased by 59.7% to US$5.059 billion.
While the Canadian and Singapore’s auto goods trade deficits, the deficit in 2010 in Canada only increased by 1.0% to US$9.423 billion, while that in Singapore decreased by 27.3% to US$502 million.
Note:
The WTO has not released data on countries such as India. This does not mean that the import and export volume of auto products in these countries is relatively low. Russia has not yet formally joined the WTO and is therefore not listed.
WEIHAI WEFISH OUTDOOR PRODUCTS CO.,LTD , https://www.wefishtackle.com