1 The basic structure and working principle of turbine flowmeter
This article uses the CniM-TM series 80mm caliber gas turbine flowmeter from Cangnan Instrument Factory as the research object, and numerically simulates the pressure loss of the internal flow channel.
Gas turbine flow meter structure diagram shown in Figure 1. The gas turbine flowmeter is shown in Figure 2, in which Figure 2 (a) is a physical map of the turbine flowmeter and Figure 2 (b) is a physical flow diagram of the turbine flowmeter core impeller.
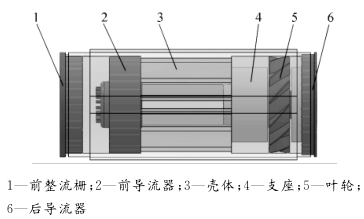
Figure 1 Gas turbine flowmeter structure
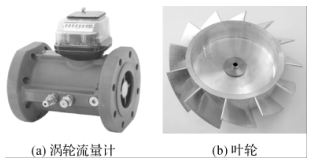
Figure 2 Turbine flowmeter and impeller physical map
The principle of the gas turbine flowmeter is that the gas flows through the flowmeter to promote the rotation of the turbine blades, and the fluid velocity is obtained by measuring the rotational speed of the impeller in the fluid in proportion to the flow velocity of the fluid, thereby obtaining the flow rate in the pipeline. Traffic value. Turbine flowmeter output pulse frequency f is proportional to the measured volume flow qv, ie
 (1)
(1)
Equation (1): k-meter meter coefficient.
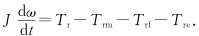
According to the law of motion, the impeller's equation of motion can be written as
 (2)
(2)
Equation (2): J-impeller inertia; t-time; ω- impeller speed; Tr-propulsion torque; Trm-mechanical frictional resistance torque; Trf-flow resistance torque; Tre-electromagnetic resistance torque.
2 Calculation Model
2.1 Mathematical model
The working medium for the numerical simulation of the turbine flowmeter is air, and the flow is in turbulent flow. The numerical simulation turbulence model adopts the Realizable K-ε model. The model is suitable for the simulation of rotational flow, boundary layer flow with strong pressure gradient, flow separation and Secondary flow, etc., its model equation is expressed as:
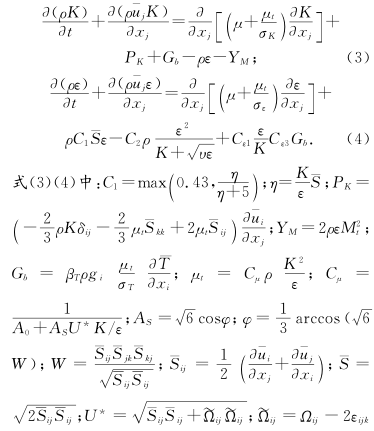


 - mean velocity of flow; a - velocity of sound; μ - dynamic viscosity coefficient; - viscous coefficient of motion; K - turbulent kinetic energy; ε - turbulent dissipation rate; βT - expansion coefficient; ωk - angular velocity;
  —The average rotation rate tensor; if buoyancy is not considered, Gb=0, if the flow is incompressible,
  =0, YM=0.
2.2 Fluid Area Meshing
Solidworks 3D design software is used to model and assemble the components of the turbine flowmeter according to the actual size, simplifying the parts that have a small influence on the fluid area such as the main shaft, pressure-receiving holes and oil filling holes.
Boolean operations are performed on the core part to obtain a pure fluid region, and then the envelope is added to the impeller to form a rotating area. Before and after the movement of the movement, a straight pipe section with a diameter of 15 times is added to ensure that the import and export flow is fully developed. Turbulence.
The total fluid area includes the front and rear straight pipe sections, the impeller envelope, and the fluid area of ​​the movement section. Using the Gambit software to mesh the 3D model, optimizing and simplifying the difficult-to-grid parts such as facets and sharp corners in the fluid area, using an unstructured hybrid mesh in the fluid area, and Impellers and other flow conditions are partially encrypted in more complex areas, as shown in Figure 3. Figure 3 (a) is the grid of the fluid area of ​​the movement, and Figure 3 (b) is the grid of the impeller. The total number of grids is about 2.3 million.
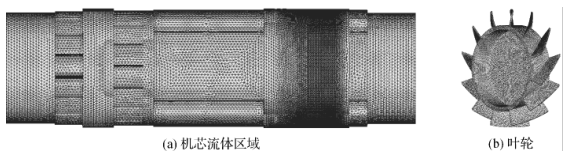
Figure 3 Turbine flow meter fluid area grid
2.3 Numerical Simulation Conditions Setting
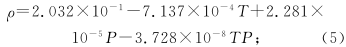
In the numerical calculation, in order to facilitate the comparison between the simulation results and the experimental results, the ambient temperature, humidity, and pressure settings are the same as the experimental conditions. The density, Ï, and dynamic viscosity η of air, air, and fluid are selected according to the calculation procedure fitting proposed by Rasmussen. The simplified formulas (5) and (6) are calculated as:
 (6)
(6)
Equation (5) (6): T-temperature; P-pressure; H-humidity.
The solver uses separate, implicit and steady-state calculation methods. The Turbulence model selects the Realizable k-ε turbulence model. The pressure force interpolation selects the Body force weighted format. The turbulent kinetic energy, the turbulence dissipation term, and the momentum equation are discarded using the second-order upwind style. The coupling with the speed is solved using the SIMPLEC algorithm, and the rest of the settings use the Fluent default value.
The calculation area uses the velocity inlet boundary conditions at the entrance of the pipeline, and the speed direction is perpendicular to the inlet straight section. The outlet boundary conditions adopt the pressure outlet. The impeller envelop is set as the dynamic flow area, the rest is the static flow area, the interface boundary condition is used as the interface, and the multiple reference coordinate model (MRF) is used for the coupling between the rotating part and the stationary part. The impeller adopts a slip boundary condition and has zero velocity with respect to a nearby rotating fluid region. The impeller speed is determined by using the TurboTopol-ogy and Turbo Report functions in the FLUENT software to constantly adjust the impeller speed and observe whether the impeller speed reaches the moment balance.
3 Analysis of Numerical Simulation Results
In the flow meter flow range, six flow points of 13m3/h, 25m3/h, 62.5m3/h, 100m3/h, 175m3/h, and 250m3/h were selected to perform numerical simulation of the same condition environment, and a gas turbine flowmeter was obtained. The internal flow field and pressure distribution data. The cross-section of the inlet is taken at the front 10mm of the front rectifier and the cross-section of the outlet is taken at 10mm after the backflow. Calculate the pressure difference at the cross-section of the inlet and outlet of the turbine flowmeter, ie, obtain the pressure loss of the flowmeter.
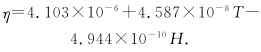
Figure 4 shows the relationship between flow rate and pressure loss. The experimental values ​​in the figure are measured using the sonic nozzle method gas flow standard device under operating conditions.
Figure 4 flow and pressure loss curve
According to the change trend of pressure loss with flow rate in Figure 4, the relationship between flow rate and pressure loss can be fitted as a quadratic polynomial. Its expression is
 (7)
(7)
This is in line with the trend of the pressure loss calculation formula (8) of the flowmeter and is a quadratic function. The numerical simulation results are in good agreement with the experimental results. It shows that the internal flow field numerical simulation method and results of the turbine flowmeter are feasible and reliable. of. Flowmeter pressure loss formula is
 (8)
(8)
In equation (8): ΔP - pressure loss; α - pressure loss factor; υ - average flow rate of the pipeline.
Taking the numerical simulation results of the flow rate Q=250m3/h as an example, the internal flow field and pressure field of the turbine flowmeter are analyzed. Figure 5 is the static pressure distribution diagram of the axial flow section of the turbine flowmeter. The pressure field distribution before and after the flow deflector The pressure is relatively uniform and the pressure gradient is small. The pressure at the connection boss of the movement housing and the impeller support is increased, and the pressure at the connection surface is gradually reduced. It is considered that the main reason for the pressure loss caused by fluid flowing through the impeller support is There is a boss at the connection, which causes a large change in the flow field, and the smooth transition cannot be achieved. It is recommended that the connection between the impeller support and the movement housing be changed to a circular or streamlined type.
Observing Figs. 5 and 6, when the fluid flows from the rear diffuser out of the turbine flow meter through the impeller, the pressure gradient changes significantly, there is a negative pressure area and causes a large pressure drop, at the rear deflector boss and the flow meter outlet The speed change is obvious. As the air flow passes through the rear diffuser, the flow path suddenly expands, forming a clear low-speed vortex on the back of the rear deflector, creating a vortex secondary flow.
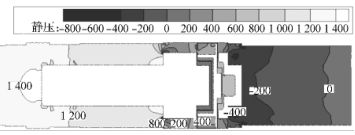
Fig. 5 Static pressure distribution diagram of axial flowmeter

Figure 6 Flowmeter axial section profile
Combining the total pressure and velocity distribution diagrams of the flowmeter axial section and the outlet cross section of Fig. 7 and Fig. 8, the velocity distribution and pressure distribution are similar, and the pressure gradient in the area where the velocity distribution in the flowmeter is evenly distributed is also smaller, ie The distribution and change of velocity in the flow channel is related to the magnitude of pressure loss. From the velocity and pressure profiles of the flowmeter axial cross-section and exit cross-section, it can be seen that the vortex secondary flow generated at the flowmeter's rear diverter affects the velocity and pressure distribution at the cross-section of the outlet, and the fluid flows spirally. Therefore, the exit velocity and pressure areas are all shifted toward the direction of fluid rotation.
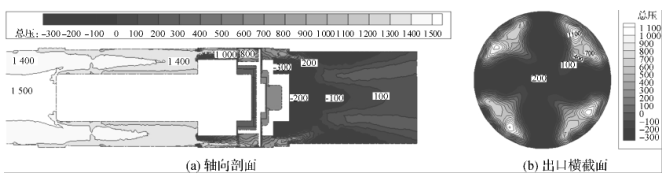
Figure 7 Flowmeter axial profile and outlet cross-sectional total pressure profile

Figure 8 Flowmeter axial profile and outlet cross-sectional velocity profile
The trend of the pressure loss of each component of the flow meter with the flow rate is the same as the change trend of the total pressure loss of the flow meter with the flow rate, and the fitting formula is a second-order polynomial with different coefficients. The pressure loss and flow rate of each component have a quadratic function relationship. With the increase of flow rate, the pressure loss increases significantly.

Fig. 9 Flow and pressure loss curves of various components
Looking at the percentage pressure loss graph of each component in Figure 10, it can be seen that the pressure loss at the front rectifier, front deflector and the movement housing is very small, and the pressure loss at the impeller support accounts for about 1/4 of the total pressure loss. The pressure loss ratio of the front rectifier is basically kept constant at each flow point, the pressure loss at the front flow deflector and the movement housing decreases slightly as the flow rate increases, and the pressure loss at the impeller support increases with the flow rate. The proportion has increased slightly, but overall it is not affected by the flow. The pressure loss at the impeller increases with the flow rate from 13m3/h to 250m3/h, the proportion of which decreases from 15.88% to 8.71%, and the drop is significant. The pressure loss at the rear deflector accounts for most of the total pressure loss, with the flow rate from 13m3 From the increase of /h to 250m3/h, the proportion of pressure loss increased from 43.77% to 55.83%, an obvious increase. In summary, the rear deflector, impeller support, and impeller are the main influencing components for the pressure loss of the fluid flowing through the turbine flow meter, which can be optimized to reduce the total pressure loss of the turbine meter.
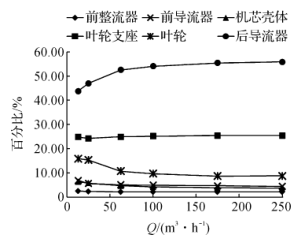
Figure 10 Percentage pressure loss of various components
Slim Rotary Damper mainly used for small diameter, long height space. Shaft Damper is used to dampen drives, control speed, and many other applications. Shaft damper are widely used in invisible screens. Shaft damper can make the movement of structures soft, quiet and safe to mitigate the impact, avoid the damage, increase the mechanical life, reduce noise, and improve product quality.

NOTE:
1. Please contact the corresponding product engineer for specific torque products
2. Max. rotation speed: 50r/min
3. Max. circle rate: 5 cycle/min(Clockwise180 °, 180 ° anti-clockwise for 1 cycle)
4. Operating temperature: -10~50℃
5. Storage temperature:-30~80℃

Applied torque: (T)
Test Temperature: 23+/-5℃
Rotating speed:20r/min
Durability test Method:Clockwise 180 °, 180 ° anti-clockwise
Rotating speed: 20r/min
Test Frequency: 1cycle/min
Test Temperature: 23±5℃
Durability test cycle: 50000cycle
Test result criteria: Store in the room temperature for 24 hours or more after the test, recording to the torque T=T±30%T.
Shaft Damper
Shaft Damper,Drive Shaft Damper,Crankshaft Damper,Flexible Shaft Coupling
Shenzhen ABD Equipment Co., Ltd. , https://www.abddamper.com